A conceptual diagram is nothing but a pretty representation of your ideas and concepts for your research. For my scientific visualization course, I attempted to make one. Armored with my new and, might I mention, cheapest drawing tablet, I started working on my conceptual diagram.
So the first task was to use colored pencils and try to sketch all the ideas you had for your research on the paper. I don’t know what it is with working on paper, but ideas flow better when working with a piece of white paper and pen.
Then you need to think about color and clarity.
And the final steps were to convert it into a conceptual diagram. To do it, you will need an idea (of course 😉 ), then one drawing tablet ( I bought mine from Amazon ( https://www.amazon.com/Inspiroy-H640P-Graphics-Battery-Free-Sensitivity/dp/B075T6MTJX/ref=sr_1_1?crid=1AUT9L9M4YA8Y&keywords=drawing+tablet&nav_sdd=aps&qid=1652568566&refinements=p_36%3A1253504011&rnid=386442011&s=electronics&sprefix=drawing+t&sr=1-1) ) , and one software (if you have access to adobe, then use adobe illustrator, or you might like Krita , which is completely free).
Then comes the fun part, actually drawing it. IAN has made it very easy for marine biologists, and you can access their vast library and choose symbols of your liking (https://ian.umces.edu/media-library/symbols/). You can choose symbols from their library and manipulate them in the illustrator.
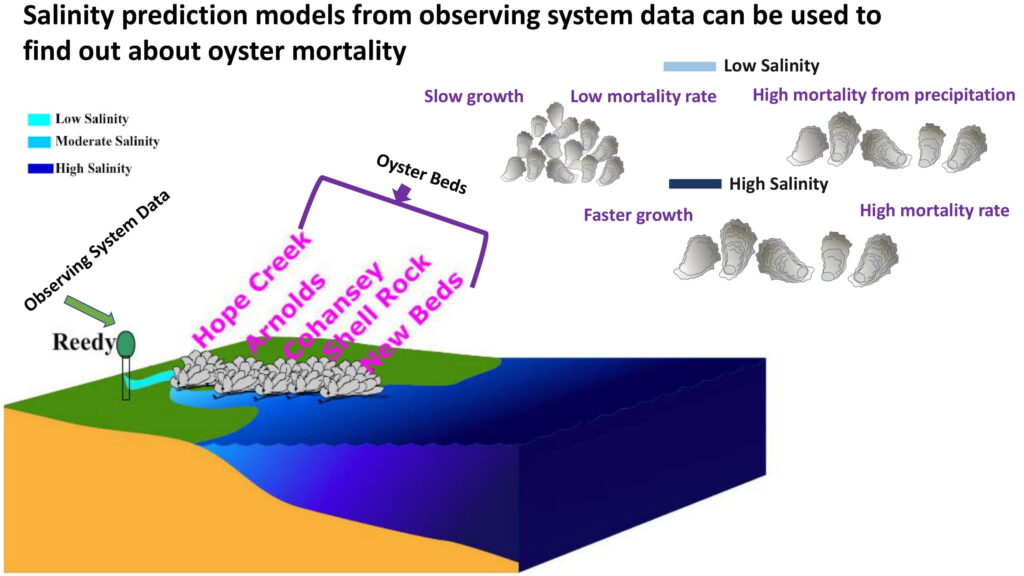
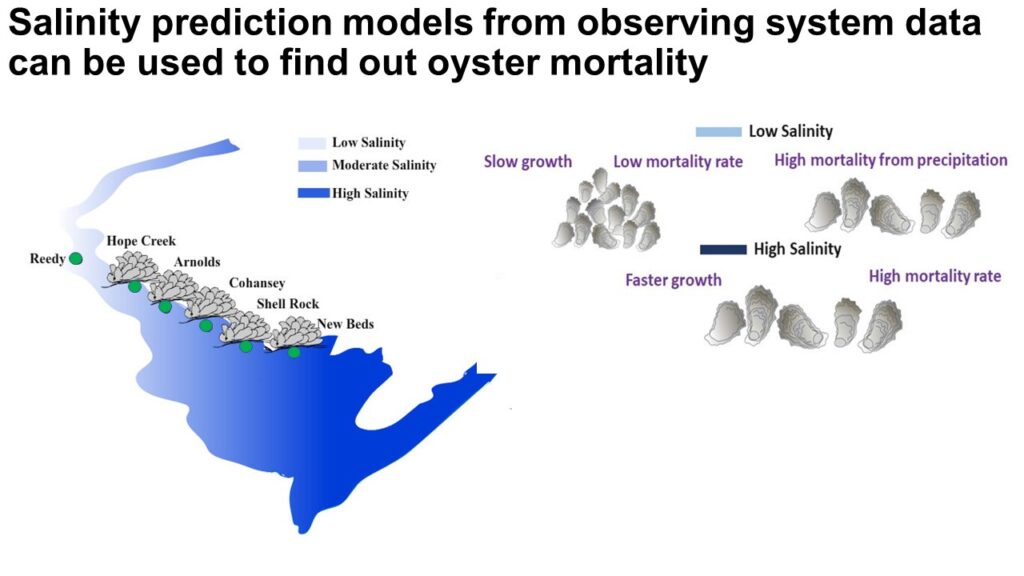
I made a figure consisting of a 3D estuary structure in my first attempt, but later, I drew a 2D estuary resembling Delaware Bay.
As a newbie, I really like working on it. The amount of satisfaction and sheer pleasure of making science easily accessible is incomparable. The way I show my pretty graphs, charts, and diagrams to everyone, you would think some Van Gogh or Leonardo da Vinci showcasing their work (:P).